В продължение на темата
"Метео прогнози, наблюдения и архив" предлагам да дискутираме възможността за получаване на добра прогноза за времето по Интернет. Както повечето от нас знаят за съжаление вече от дълго време не работи:
HRM модела на НИМХ -
http://weather.bg/hrm/hrm.html
Причините, струвами се, са безкрайно познати за нашата действителност, а именно липсата на средства. Германците ни бяха предоставили за известен период от време безплатно ползването на дигитален модел за краткосрочна прогноза с много данни, касаеща не само специалистите в дадената област, а и хора като нас - можещи да ползват до известна степен подадената информация. На въпроса на Иван Ценов от Ботевград към тях се получи следният отговор:
Цитат:
Здравейте,
Засега е така. За в бъдеще не мога да Ви кажа как ще бъде.
Приятен ден!
Минка Стоянова
Ivan Cenov wrote:
> Здравейте,
> От известно време не излизат страниците на HRM модела.
> Така ли ще бъде за в бъдеще или страниците временно са
> недостъпни ?
Така че от НИМХ в скоро време единствено можем да ползваме прогнозата на дежурният синоптик,
http://weather.bg/bg/indnew1.php?glaven=progn звучаща така:
Цитат:
"Прогноза за 29.11.2006
Слънцето в София изгрява в 7 ч. и 34 мин. Ще залезе в 16 ч. и 55 мин. Денят продължава 9 ч. и 21 мин.
Луната изгрява в 13 ч. и 40 мин. Ще залезе в 1 ч. и 53 мин. след полунощ. Фаза - един ден след първа четвърт.
Най-ниската температура на 29 ноември в София е била измерена през 1915 г. минус 17,8°, а най-високата през 1923 г. 18,4°.
Най-ниската температура на тази дата в Пловдив е измерена през 1915 г. минус 13,4°, а най-високата през 1952 г. 19,8°.
В Плевен на тази дата най-ниската температура е измерена през 1915 г. минус 14,8°, а най-високата през 1923 г. 27,2°.
Атмосферното налягане ще остане по-високо от средното за ноември.
През нощта над по-голямата част от страната ще има ниска слоеста облачност или мъгла. Минимални температури между 2 и 7°.
Утре ще бъде предимно облачно. Ще се появи слаб, по Черноморието до умерен североизточен вятър. Около обяд мъглите ще се разсеят. Само на отделни места слабо ще преръми. Максимални температури между 8 и 13°. За София минимална температура около 2, максимална около 9°.
В планините ще има променлива облачност. Ще духа слаб до умерен вятър от изток-североизток. Температури на височина 1200 метра около 6°, на 2000 метра - около 3°..."
или да видим малка карта на България с няколко символа на нея:
http://meteo.bg с опция ако допуснете pop-up
http://meteo.bg/map/bgmap.php?lang=bgДруг известен български сайт за прогнози -
http://weather.aster.net също от известно време не работи. Там прогнозата беше съставена в графика показваща диаграма на свойствата и данните на въздуха във височина.

Тука е необходимо да сложим коментара на
Живо за пояснение на диаграмата:
Цитат:
Червената начупена линия представя температурата на въздуха във височена.
Зелената представя точката на оросяване във височина.
Кафявата линия е успоредна на тъмночервените линии и тръгва от точката на оросяване при земята.
Светлосинята линия е пътя на балона от земята нагоре докато температурата му се изравни с тази на околния въздух.
Дългата тъмносиня линия е нивото на кондензация (тоест базата), а късата е нивото до което ще достигат облаците.Или накратко -
колкото по-голяма е зоната между сухата адиабата и тази на балона
толкоз по-яко е за летене .Не съм сигурен кога цебясва - можеби
когато сухата и мократа адиабата са близо при височини подходящи
за ЦБ...
Подобна графика може да се види в сайта на TV MET , раздел прогнози --> спортно летене:
http://www.tvmet.bg/
неприятното в дадения случай е че не е пояснен района на прогнозата.
Аз лично най-често ползвам информацията на ПСС в:
http://www.pss.bglink.net/vremeto/regio ... egion_id=5
там може би инфото е най-достоверно от ранните часове на деня, но през целият ден не се актуализира и за останалото време трябва да се търси информация от други сайтове или по телефона на НИМХ
0900-12-015 (0.80 лв./мин.) .
От скоро работи сайта за Мусала:
http://beo-db.inrne.bas.bg/moussala/
там може да се видят всички графики и метеограми интересуващи специалистите. Сайта е отлично представен във всяко едно отношение, но за съжаление липсва коментар и прогноза като цяло.
Бих споменал и друг български сайт:
http://weather.digsys.bg/c/index.pl%3Fp ... =_bul.html
където може да се получи информация в много по достъпен за всички вид. Интересното в този сайт е че има и няколко уеб камери, даващи визуална моментна информация от даденото място.
Други уеб камери, работещи по високите части на България могат да се видят на:
1.
http://www.bulgariaski.com/borocam/ камери от Банско, Боровец и Пампорово
2.
http://www.banskoski.com/kameri.xhtml от Банско
3.
http://livecam.feratel.at/cam/sofia/130 ... 4&language от София,
последната работи само през ски сезона.
От чуждите сайтове бих започнал с:
http://bulgarian.wunderground.com/global/BU.html
в сайта има информация от 35 метео станции в България, болшинството от които се актуализират през три часа. Там са включени и високопланинските Мусала, Ботев, Черни връх и Мургаш. Така също може да се види пет дневна прогноза за всяка станция по отделно:
 http://bulgarian.wunderground.com/globa ... 15627.html
а за хората които разбират от HTML може да се ползва код за поставяне на стикер на вашата уеб страница с информация от интересуващото ви място:
 http://bulgarian.wunderground.com/geo/B ... 15627.html
Тридневна по часова прогноза може да намерите на:
http://www.weather.com/outlook/travel/b ... v_business
от където също може да се изтегли
"Free IE7 weather toolbar", поставящ в тулбара ви икона с моментното състояние на времето от дадено място:
http://download.weather.com/web/toolbar ... wctool.exe
За мен по ясно се вижда прогнозата на:
http://www.weather-forecast.com/locatio ... 1to3.shtml
Тук е дадена височината на точката на замръзване - 0 градуса. За съжаление в този сайт липсва възможност да се избере връх Ботев и най-близката точка е Казанлък.
Подобни прогнози могат да се видят в сайтовете на CNN, BBC, Yahoo, Gismeteo и други. Нека сега да погледнем в сайтове с по професионална насоченост в метеорологията и да започнем с Para2000.org
http://para2000.free.fr/weather/mto-bul-r.html
както се вижда нищо по съществено от много родни и сродни сайтове за прогноза. По интересна информация може да се види в сайтовете на университетите по света, по специално в Европа и Сев. Америка. За пример давам университета в Базел, Швейцария от където черпят данни и колегите от DHV.
http://pages.unibas.ch/geo/mcr/3d/meteo/
Тук има много подробна информация за цяла Европа, но при хубаво антициклонално време информацията е малка, защото мащаба на метео картите е такъв че не могат да се видят типично местните условия. Същото важи и за другите чужди сайтове, примерно графиките в COLA -
http://wxmaps.org/pix/euro.24hr.html
където всяка от тях е съпроводена с пояснителен панел:
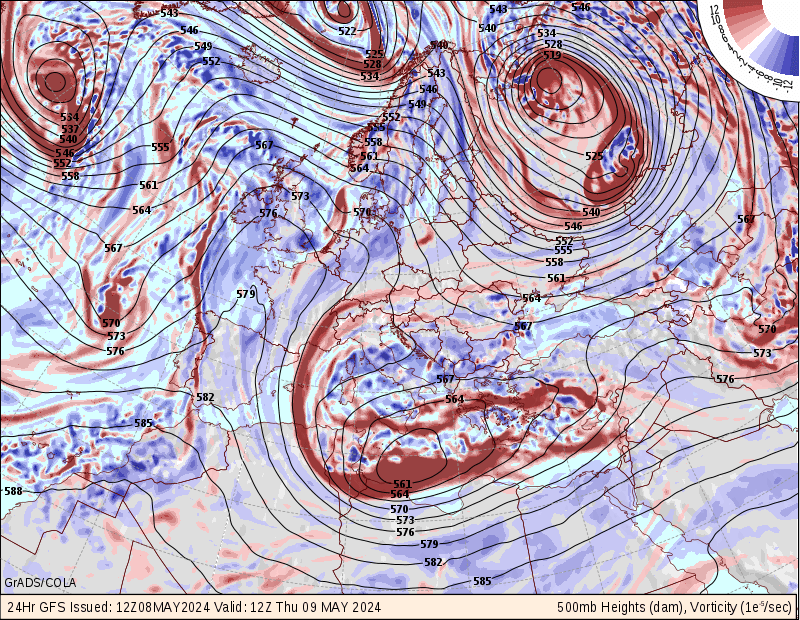 Panel 1
500mb Geopotential Heights, Height Change and Vorticity
Black contours indicate the geopotential height of the 500 millibar surface, in tens of meters.
Low geopotential height (compared to other locations at the same latitude) indicates the presence of a storm or trough at mid-troposphere levels.
Relatively high geopotential height indicates a ridge, and quiescent weather.
In the forecast panels, the colored contours indicate the change in geopotential height during the 12 hours leading up to the valid time.
Decreasing geopotential height usually indicates an approaching or intensifying storm.
Increasing heights usually indicate clearing weather for the period.
The color shading indicates vorticity at 500 millibars: Red for positive vorticity, blue for negative.
Positive vorticity indicates counterclockwise rotation of the winds, and/or lateral shear of the wind with stronger flow to the right of the direction of flow.
Negative vorticity indicates clockwise rotation of the winds, and/or lateral shear of the wind with stronger flow to the left of the direction of flow.
Positive (or negative in the Southern Hemisphere) vorticity at 500 millibars is associated with cyclones or storms at upper levels, and will tend to coincide with troughs in the geopotential height field.
Negative (positive in SH) vorticity is associated with calm weather, and will tend to coincide with ridges in the geopotential height field.
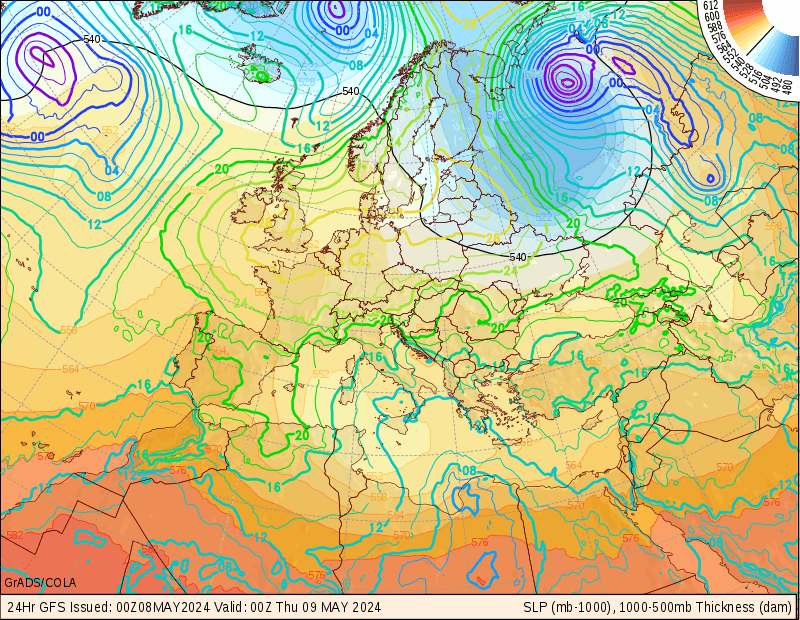 Panel 2
Sea Level Pressure and 1000-500mb Thickness
The colored contours indicate sea level pressure in millibars. High pressure is red, low pressure in green or blue. Only the last 2 digits shown -- sea level pressure is usually around 1000 millibars, so add 1000 to values in the range of 00-50, and add 900 to values in the range of 50-98.
Low sea level pressure indicates cyclones or storms near the surface of the earth. High sea level pressure indicates calm weather.
The black contours indicate the vertical distance, or thickness, between the 1000 millibar surface and the 500 millibar surface, measured in tens of meters.
Since air behaves nearly as an ideal gas, and vertical distance is proportional to volume over a specified surface area, the thickness between two pressure levels is proportional to the mean temperature of the air between those levels. Thus, low values of thickness mean relatively cold air.
The 540 line is highlighted, since this line is often used as a rule of thumb to indicate the division between rain and snow for low terrain. When there is precipitation where the thickness is below 540dam, it is generally snow. If the thickness is above 540dam, it is usually rain (or sleet if the air next to the surface is below freezing).
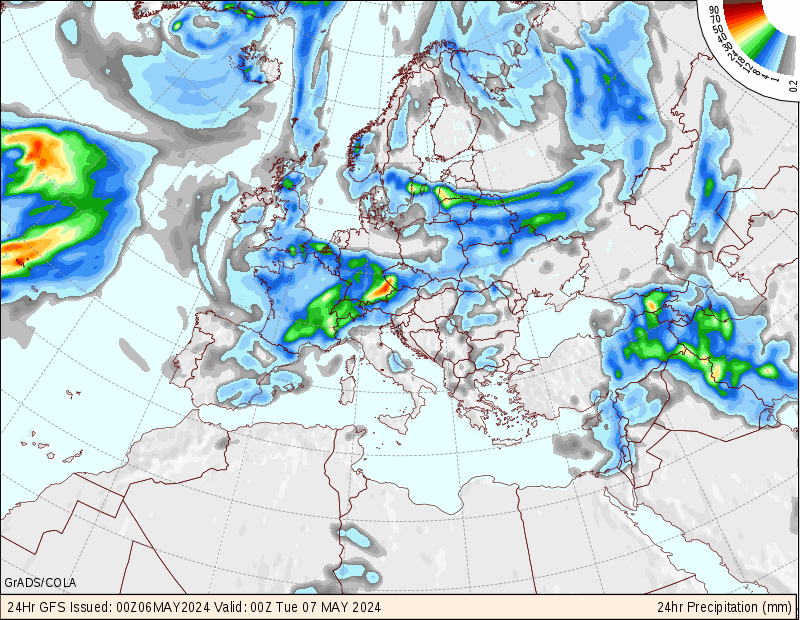 Panel 3
Vertical Velocity and Precipitation
The colored contours indicate vertical velocity of the wind at the 700 millibar level, in millibars per hour (since pressure decreases with height, negative values indicate ascending air, and positive values denote sinking).
Ascending motion is associated with cloudiness and rain. Large negative values of vertical velocity correspond to areas of heavy rainfall if moisture is available (see description of panel 4). These areas tend to correspond with the storms in the first two panels.
The green shading in the forecasts indicate 12 or 24 hour accumulated precipitation, measured in millimeters.
The total is the amount of rainfall forecast during the 12 or 24 hours immediately preceding the verification time in the lower lefthand corner of the map.
Comparison with the 540 thickness line in panel 2, and the 0?C isotherm in panel 4 can give a good indication of the dividing line between snow and rain.
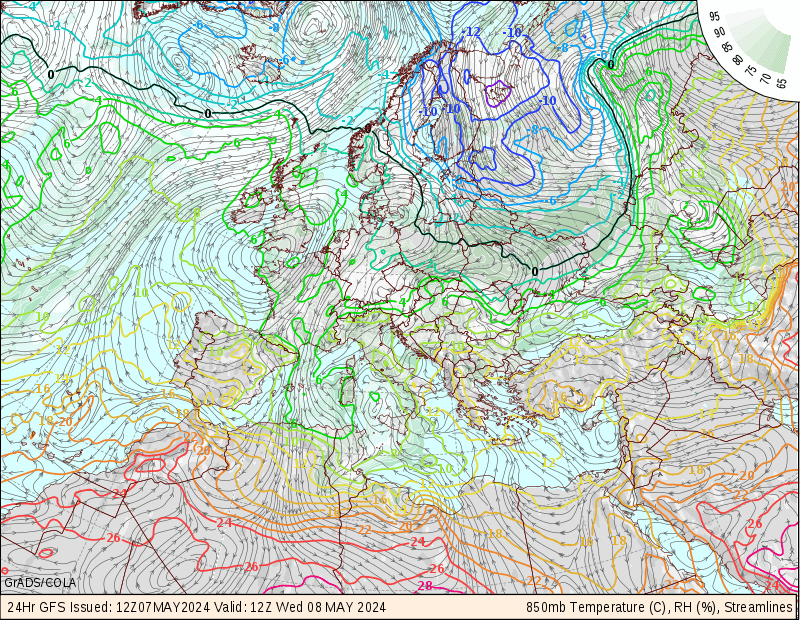 Panel 4
850mb Temperature, Humidity and Winds
Colored contours indicate the air temperature at the 850 millibar level, in degrees Celsius. The 0?C contour is highlighted, as this is also often used as a divider between rain and snow.
The green shading indicates the relative humidity percentage at the 850 millibar level. High values indicate the availability of moisture. When large rates of ascent (in panel 3) are located with high moisture availability, heavy rainfall will likely occur.
The barbs indicate the direction and speed of the wind, in meters per second. Each full barb indicates 10 m/s, and each half barb 5 m/s. The direction of the wind is parallel to the shaft with the barbs pointing into the wind.
Advection of moisture by the wind can be inferred by noticing the direction and rate at which moist areas appear to be blown. Similarly, temperature advection can be inferred by noticing whether the wind is blowing cold air toward a warm region, or warm air toward a cold region.
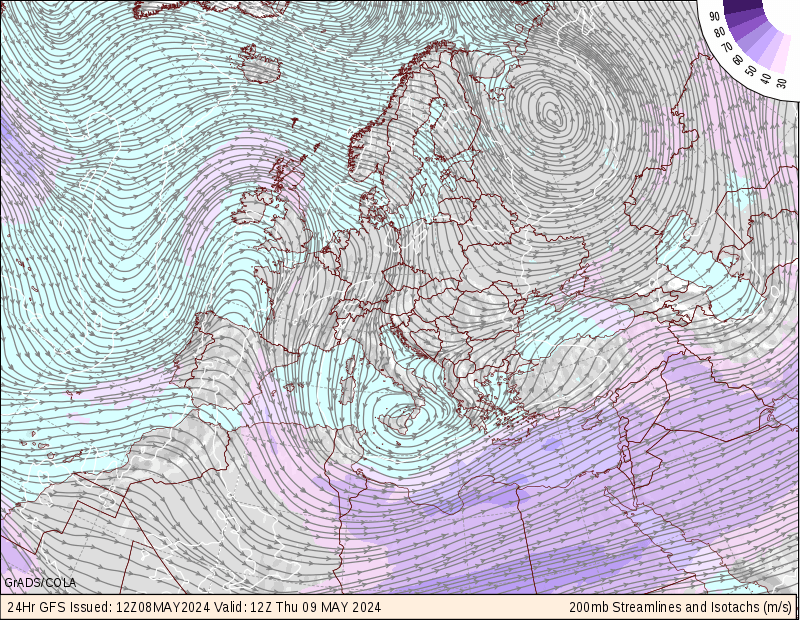 Panel 5
200mb Winds
Purple shading indicates the speed of the winds at the 200 millibar level, in meters per second. This altitude is near the level of the core of the jet stream. So the tracks of the jet streams can be seen very clearly.
The streamlines indicate the direction of flow of the wind, which is generally from west to east throughout most of the subtropics, mid- and high-latitudes.
The color of the streamlines indicates a relative measure of divergence of the flow in the upper troposphere. Orange and red indicates strong divergence at upper levels, usually associated with strong vertical velocities in the middle troposphere, and severe weather/heavy rainfall.
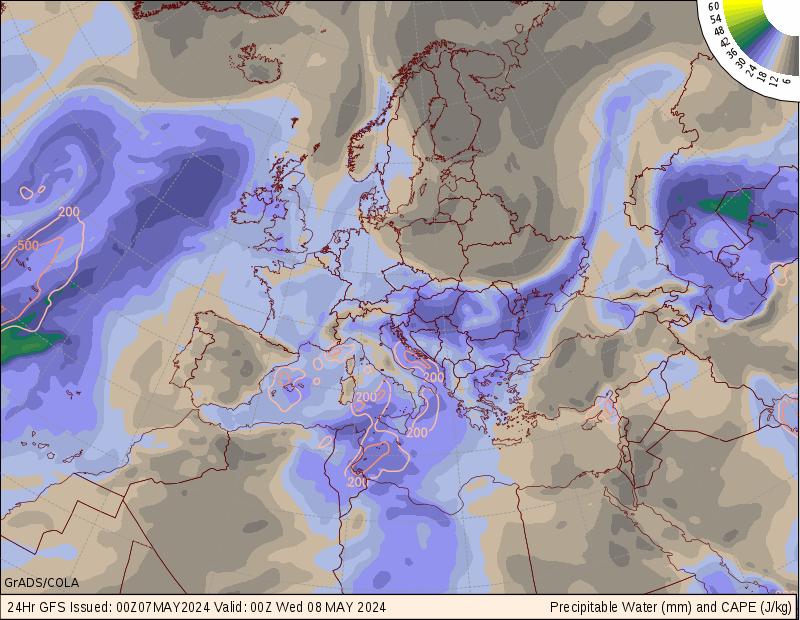 Panel 6
Precipitable Water and Convective Available Potential Energy (CAPE) or Total-Totals Index (TTI)
The colored contours indicate total precipitable water in the atmosphere. Precipitable water is the total depth of liquid water that would result if all water vapor contained in a vertical column of air could be "wrung out", leaving the air completely dry. It indicates the total humidity of the air above a location, and is a good indicator of the amount of moisture potentially available to supply rainfall.
In the analysis and forecasts for the ETA model, the yellow-brown shading indicates the amount of CAPE in the atmosphere, which is a good indicator of the potential for strong thunderstorms and severe weather. High values of CAPE indicate that most (but not necessarily all) conditions exist for strong thunderstorms.
For the other models the yellow-brown shading indicates the value of the TTI, which is a measure of the vertical stability of the atmosphere, and over central and eastern North America is also a good empirical indicator of the potential for severe weather.
TTI = TD[850]-T[500] + (T[850]-T[500])
where T is temperature, TD is dew point (both in Celsius), and the [number] is the pressure level.
Values of TTI of around 40-45 indicate the potential for thunderstorms. Around 50, severe thunderstorms are possible. Around 55, storms producing tornados are possible. This rule-of-thumb does not hold over western North America and other areas where there is alot of high terrain.
Не трябва да пропускаме и
http://www.arl.noaa.gov/ready/cmet.html където трябва да се въведат само географските координати на дадено място за да се получат много хубави метеограми.
В заключение бих споменал че най-доброта решение за нас е поставянето на малка метео станция с камера на някои от най-използваните стартове в България, с директна интернет връзка и "он-лайн" предаване. За пример бих посочил един линк към 298 камери на една австрийска фирма работещи в планините на Европа:
http://livecam.feratel.at/


